Recent version change in Disk I/O metrics
We have become accustomed to seeing read vs writes in the Disk I/O metrics panes of the Server Overview window. However, since our latest update (we went from .37 to .56) it appears to be total I/O on a server/vm/host level without the read/write separation. I can't find anywhere in the release notes where this was changed. Is this a bug or intentional change not documented in the release notes? Losing the read/write visibility is not particularly an improvement.
Thanks.
Thanks.
Tagged:
Best Answer
-
 Alex B
Posts: 1,158 Diamond 4
Hi @bmaynard,
Alex B
Posts: 1,158 Diamond 4
Hi @bmaynard,This was changed in version 12.1.38 (release notes):
Changes
- The disk I/O metric in the activity graph has been changed to total bytes per second instead of transfers per second.
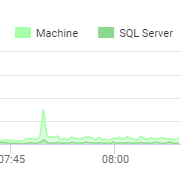
It now the total I/O and the portion that is due to SQL Server to be more inline with the CPU and RAM metrics as they show both Total for the machine and SQL Server's utilization portion as well:

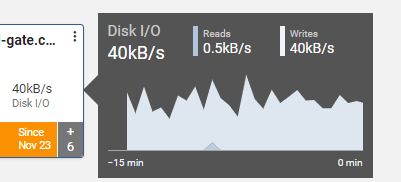
As for seeing the split of Read/Write, you can hover over the card on the dashboard to see the current values:

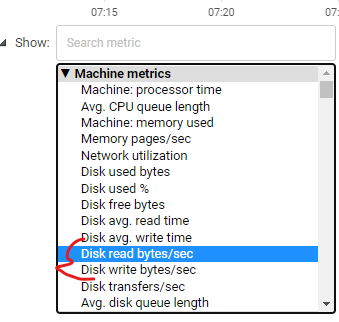
And to get a graph like you are used to, you can go to the Analysis graph and add the individual Read/Write metrics to see the split out values:

Kind regards,
Alex


Answers
Thanks.
There aren't any specific plans currently to add auto-refresh to the Analysis page, but the page does need to be updated still. You should vote on this suggestion on the SQL Monitor Uservoice related to that: https://sqlmonitor.uservoice.com/forums/91743-suggestions/suggestions/10991616-allow-analysis-graphs-to-update-with-realtime-data related to refreshing the analysis graph.
Apart from that, this button jumps to the present time so clicking that periodically (rather than refreshing the entire page) would perform a similar action (not ideal though, I understand):
Kind regards,
Alex
Have you visited our Help Center?