.net core profiling can never find source
Every time I profile a .net core application all the methods are always without source. Any workaround am I doing something wrong?
Tagged:
Best Answer
-
 Alex B
Posts: 1,158 Diamond 4
Hi @ByronP,
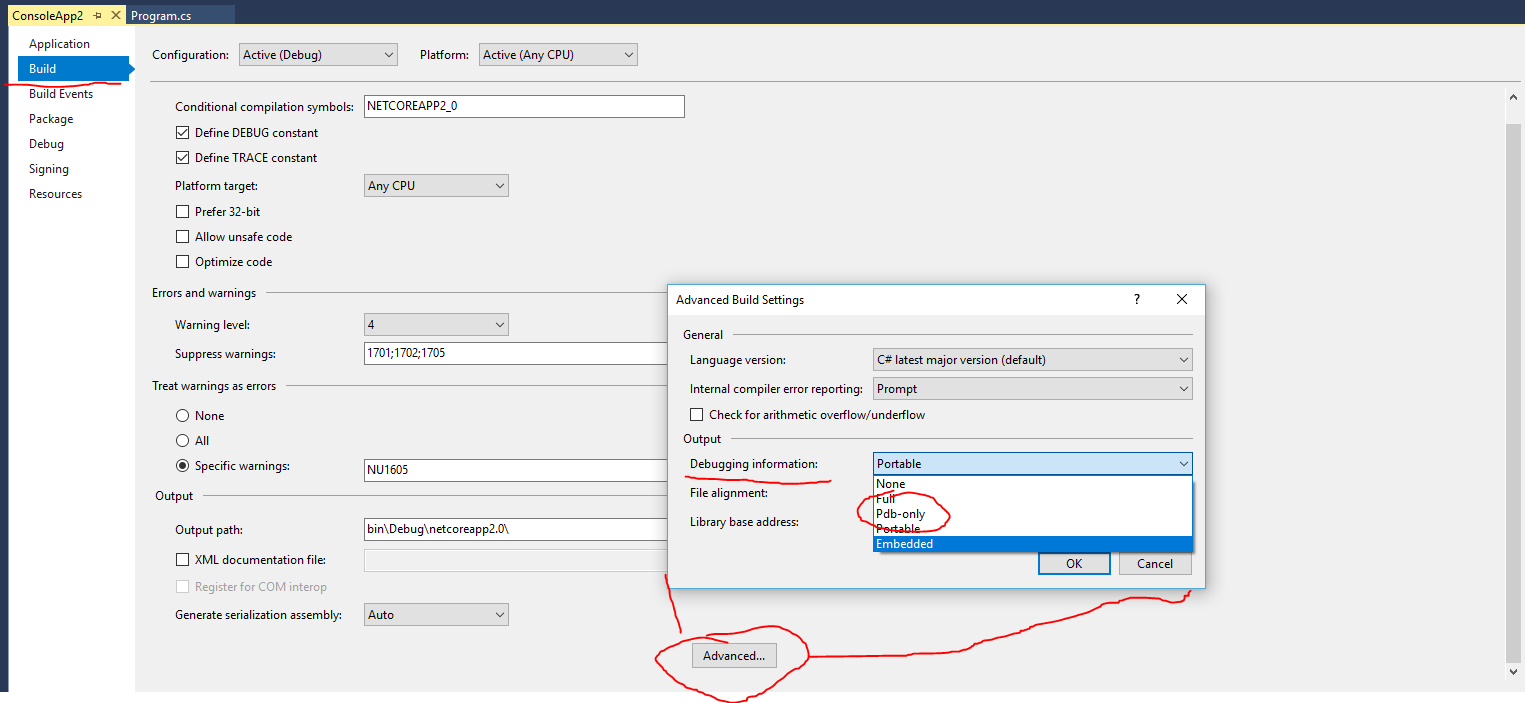
It looks like the issue is due to .NET Core applications using portable PDB files by default which currently do not work in ANTS Performance Profiler. To get this to work you will need to edit the projects to generate non-portable PDB files.
To do this, right-click on the project and choose Properties, then click Build at the left and then the "Advanced" button at the bottom of the page. In the window that pops up choose the dropdown next to "Debugging information (under the "Output" section) and change this from "Portable" to "PDB-only" or "Full" and then ANTS Performance Profiler will be able to see the source code.
I hope that helps!
Kind regards,
Alex


